
Race Code Processing results

When using the Race Code Functions there are a number of outputs from the camera processing which can be used.
These are the values used internally by Formula.py to keep racing around the track.
Click on any of the diagrams below for a larger view.
TrackFound() → found
This indicates if the track was correctly found or not.
A value of True indicates that the YetiBorg can see the track and is running normally.
A value of False indicates that the YetiBorg cannot see the track, it may have crashed into the wall!
CurrentTrackPosition() → position
This returns the lane number the YetiBorg is currently on.
The lane numbers are where the colour boundaries are:
| +3 | wall | red | Far outside of track |
| +2 | red | blue | |
| +1 | blue | red | |
| 0 | red | green | Center of track |
| -1 | green | blue | |
| -2 | blue | green | |
| -3 | green | wall | Far inside of track |
The value returned is a full decimal value, for example +1.2 would mean we are just a bit to the left of the blue | red line.
The lane YetiBorg is aiming for can be adjusted during the race with the AimForLane(position) call.
CurrentAngle() → degrees
The value returned is the difference in angle between the way YetiBorg is facing and the way the track is going.
In the diagram the angle measured is between the orange line (the track direction) and the light blue line (the YetiBorg direction.
When approaching a corner this value will tend to change faster as the bend gets more pronounced.
In other words the angle will change rapidly when close to or on a bend.
The value returned is in degrees, positive (+) values mean the track is going right compared to the YetiBorg, negative (-) values mean the track is going left compared to the YetiBorg.
TrackCurve() → curveAmount
This value gives an indication of how much the track is bending to the left or the right.
In the diagram the bending is measured within the light blue loop in front of the YetiBorg.
Values which are positive (+) mean the track is bending to the right, negative (-) means the track is bending to the left.
When the track curves more in the measured section the value returned is larger as well.
Values around zero indicate the track is straight in the section ahead.
TrackLines() → linesList
If you want all of the information from the image processing then this is the call for you.
This call returns a set of points for each line in the image it found.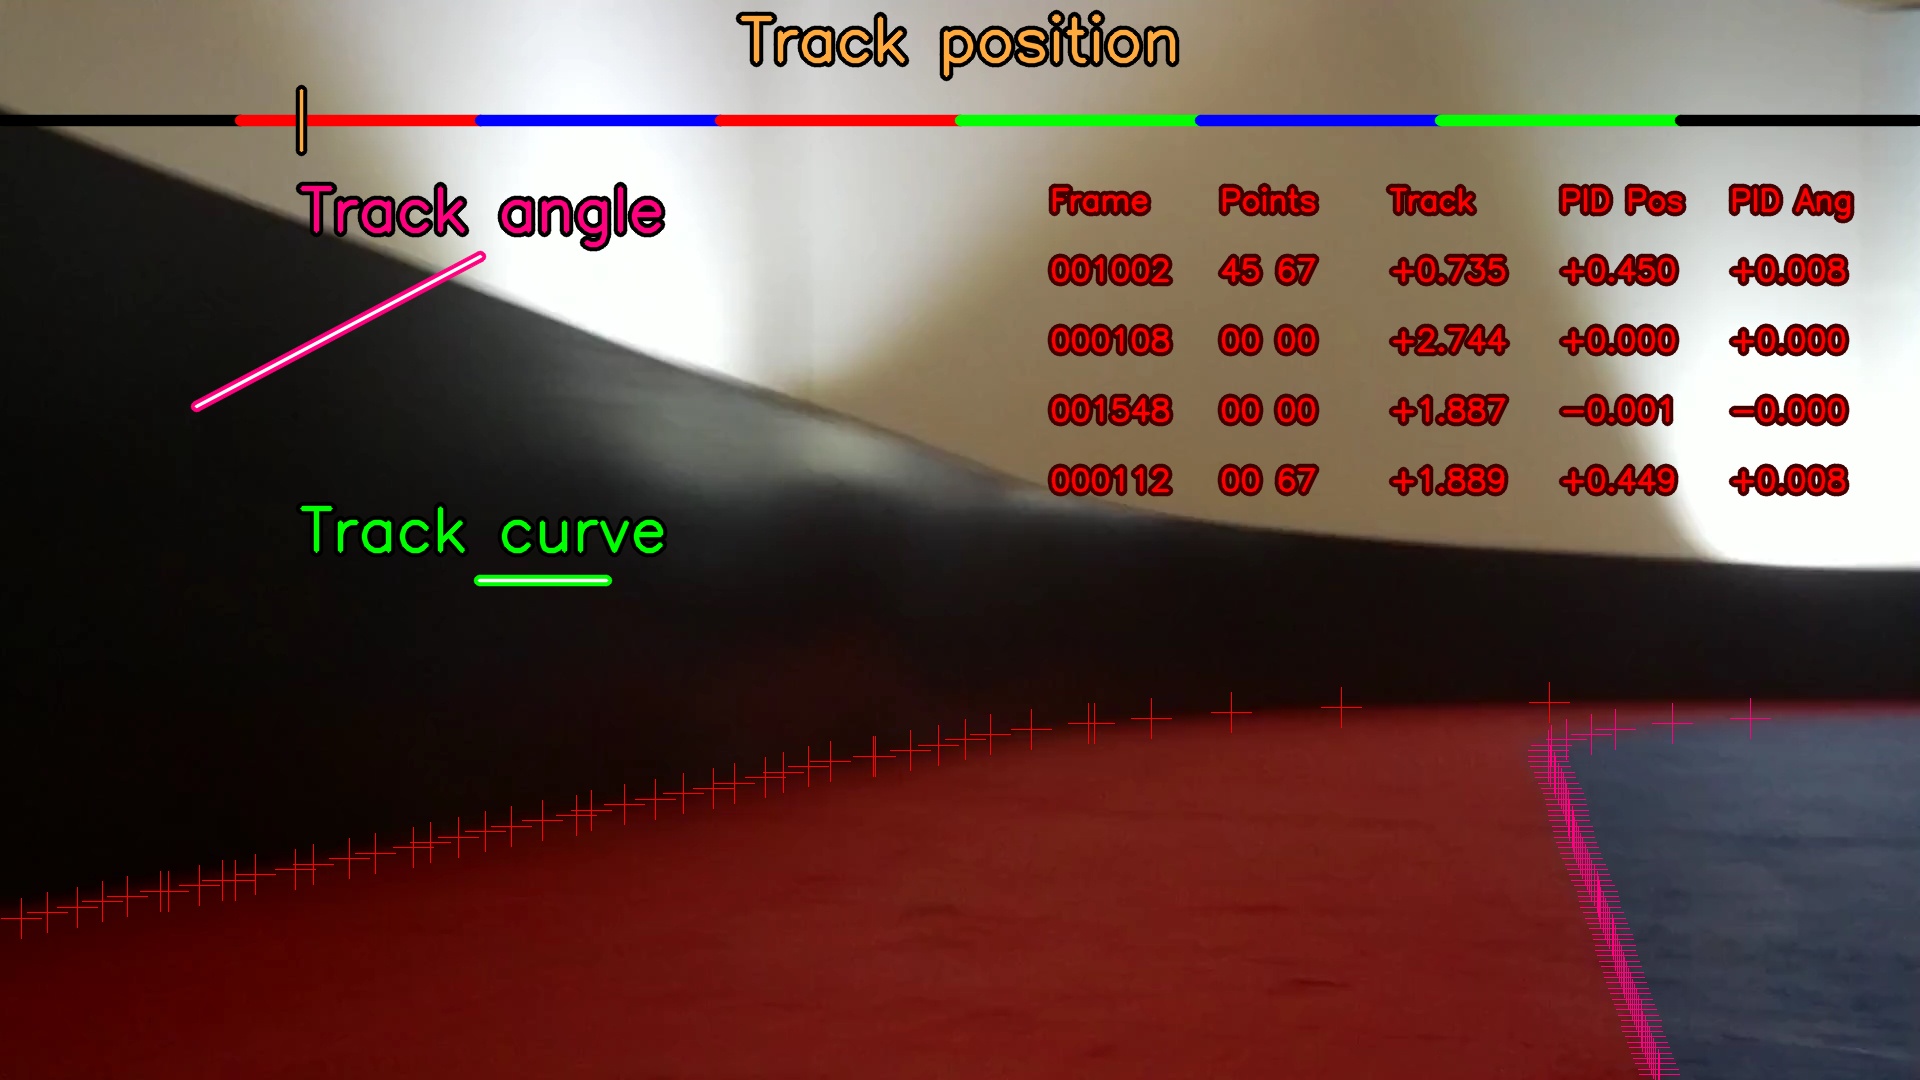
The image above shows the points found as crosses, each of these is returned in a list with all the other points of the same colour.
These are the points the code uses to generate the values for all of the above calls.
With the points you can either compute these values yourself or generate your own data based on the lines seen.
Add new comment